Data의 clustered region이 얼마나 되는지, 얼만큼 나눌 수 있는지 measure가 필요한 경우가 있다.
install.packages(c("factoextra", "fpc", "NbClust"))
library(c(factoextra,fpc,NbClust,ggplot2))
df <- read.table("data.txt",sep="\t")
df1 <- df[,3:4] # Select 3rd and 4th columns
df2 <- df[,c(3,5)] # Select 3rd and 5th columns
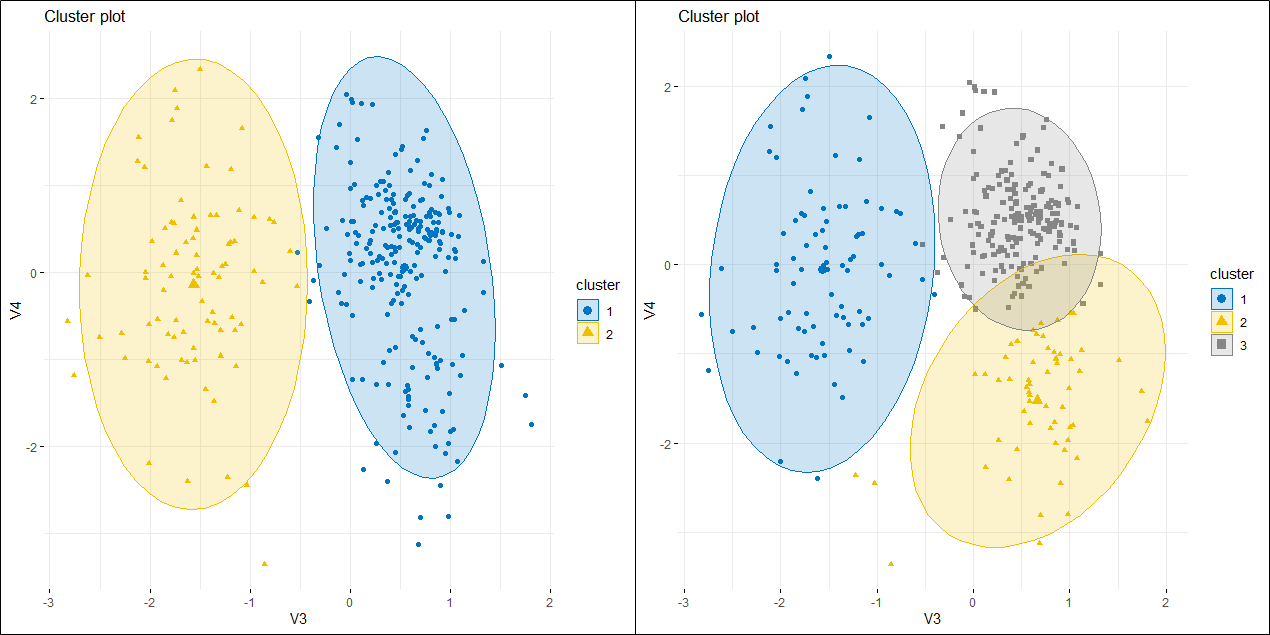
km.res <- eclust(df1, "kmeans", k = 2, nstart = 25, graph = FALSE)
# k: number of cluster, nstart: initial configuration or centroid
fviz_cluster(km.res, geom = "point", ellipse.type = "norm", palette = "jco", ggtheme = theme_minimal())
hc.res <- eclust(df1, "hclust", k = 2, hc_metric = "euclidean", hc_method = "ward.D2", graph = FALSE)
fviz_dend(hc.res, show_labels = FALSE, palette = "jco", as.ggplot = TRUE, rect = TRUE)
- PCA 결과를 phenotype에 따라 나타내 주었을 때,

- PCA 결과를 phenotype을 주지 않고 k-means clustering으로 분류하게 했을 때,
- Sample hierarchy

Reference
- https://lukedaniels1.github.io/Bio381_2018/Daniels_Cluster_Analysis_Lecture.html
- https://www.datanovia.com/en/lessons/cluster-validation-statistics-must-know-methods/
- https://rstudio-pubs-static.s3.amazonaws.com/229983_4d4498cb3a5f416e96b87b158f55965e.html
- https://scikit-learn.org/stable/auto_examples/cluster/plot_kmeans_silhouette_analysis.html
- https://velog.io/@i-zro/ml-clustering
- https://vsoch.github.io/2013/the-gap-statistic/
- https://statweb.stanford.edu/~gwalther/gap
'R' 카테고리의 다른 글
| [R] predict (0) | 2021.10.19 |
|---|---|
| [R] Enhanced Volcano plot (0) | 2021.10.12 |
| [R] boxplot options (0) | 2021.10.06 |
| [R] install packages (0) | 2021.10.05 |
| [R] basic (0) | 2021.05.25 |


댓글