Poisson vs. Negative Binomial distribution
Poisson distribution,
: 일정한 간격 동안 이벤트가 발생할 확률로 정의한다.
- Parameter :

library(tidyverse)

x.values <- seq(0, 20, 1)
break.values <- seq(0, 20, 2)
y1 <- dpois(x.values, 10)
y2 <- dpois(x.values, 4)
y3 <- dpois(x.values, 1)

df <- data.frame(x.values, y1, y2, y3) %>%
  gather(-x.values, key = "lambda", value = "values") %>%
  mutate(lambda = case_when(lambda == "y1" ~ "lambda = 10",
                            lambda == 'y2' ~ "lambda = 4",
                            lambda == 'y3' ~ "lambda = 1",
                            TRUE ~ NA_character_))

g <- ggplot(df, aes(x.values, y = values, fill = lambda)) +
  geom_col(position = "dodge") +
  labs(x = "k", y = "Probability", fill = NULL) +
  scale_x_continuous(breaks=break.values, labels=break.values)

g
Binomial distribution,
: 성공 확률이
:
여기서
이는 Negarive Binomial distribution 과 같은 의미가 된다.
Negative Binomial distribution,
: Binomial 과 달리
- Parameter :
- Mean and Variance :
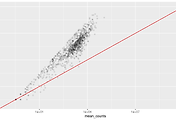
Poisson distribution과 Negative Binomial distribution의 관계 :
이것을 variance에 대입하면,
Poisson distribution은 Negative Binomial distribution 의 특별한 케이스이며, 데이터가 over-dispersed 되어 있는 경우에 Negative Binomial distribution으로 모델링을 한다. 즉, variance 가 큰 경우 Negative Binomial 에서 confidence interval이 더 넓기 때문에 모델링하는데 더 적합하다.
- Precaution :
* 샘플 사이즈가 적은 데이터에 사용하면 안된다.
* 0 count 가 많은 데이터에 사용할때 조심해야 한다. ( Zero-inflated regression 으로 모델링하는게 더 낫다.)
* 음수가 있는 데이터에 사용하지 않는다.
x.values <- seq(0, 100, 1)
break.values <- seq(0, 100, 25)
r <- 20

# dnbinom(실행횟수, 성공횟수, 성공확률, log = FALSE)
y1 <- dnbinom(x.values, k, 0.25)
y2 <- dnbinom(x.values, k, 0.5)
y3 <- dnbinom(x.values, k, 0.75)

df <- data.frame(x.values, y1, y2, y3) %>%
  gather(-x.values, key = "lambda", value = "values") %>%
  mutate(lambda = case_when(lambda == "y1" ~ "p = 0.25",
                            lambda == 'y2' ~ "p = 0.5",
                            lambda == 'y3' ~ "p = 0.75",
                            TRUE ~ NA_character_))

g <- ggplot(df, aes(x.values, y = values, fill = lambda)) +
  scale_fill_discrete(name=paste0("r = ",r)) +
  geom_col(position = "dodge") +
  labs(x = "Random variable", y = "Probability", fill = NULL) +
  scale_x_continuous(breaks=break.values, labels=break.values)

g
Reference
- https://en.wikipedia.org/wiki/Poisson_distribution
- https://towardsdatascience.com/use-a-negative-binomial-for-count-data-c68c062de203
'Statistics' 카테고리의 다른 글
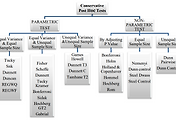
| Post Hoc tests (0) | 2021.12.16 |
|---|---|
| Mean vs. Variance (0) | 2021.10.20 |
| Correlation coefficient (0) | 2021.08.19 |
| Regression error (0) | 2021.07.04 |
| Multiple test correction (0) | 2021.06.10 |
댓글