Wikipedia에 따르면 F-statistics, Fst,는 다음과 같다.
"In population genetics, F-statistics (also known as fixation indices) describe the statistically expected level of heterozygosity in a population; more specifically the expected degree of (usually) a reduction in heterozygosity when compared to Hardy–Weinberg expectation."
"F-statistics can also be thought of as a measure of the correlation between genes drawn at different levels of a (hierarchically) subdivided population."
즉, 집단유전학에서 Fst는 heterozygosity의 비율을 이야기한다. 그리고 subpopulation이 얼마나 다른지를 나타내는 measure로 쓰인다.
Hardy-Weinberg equilibrium(HWE)에서는 inbreeding coefficient라고 부른다. 왜 이 값을 population을 분류하는데 사용할 수 있을까? 그 이유는 HWE의 가정 자체에 있다.
Hardy-Weinberg Principle
Assumption :
- organisms are diploid
- only sexual reproduction occurs
- generations are nonoverlapping
- mating is random
- population size is infinitely large
- allele frequencies are equal in the sexes
- there is no migration, gene flow, admixture, mutation or selection
https://en.wikipedia.org/wiki/Hardy%E2%80%93Weinberg_principle
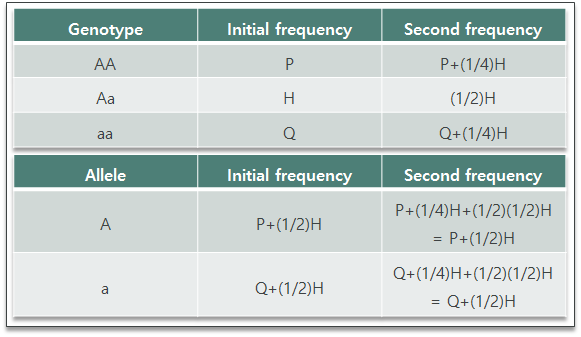
예를 들어 자화수정(self fertilization)을 한다고 하자. 이것은 non-random mating이고, 수정이 끝난 이후에도 allele frequecy는 같은 값을 가지게 된다. 그리고 시간이 지날수록 heterozygosity는 줄어들게 된다.

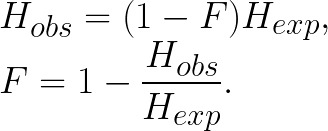
Inbreeding coefficient 식, F=1-(H_obs/H_exp), 을 보면, population에서 heterozygote가 없다면, 즉 inbreeding에 의해서 없어졌다면 1인 값을 가질 것이고, random mating이 일어나 HWE를 따르는 확률을 가진다면 inbreeding coefficient는 0을 값을 가질 것이다.
위 식을 다음과 같이 설명할 수도 있다. Inbreeding이 있었다면 random mating이 있었을 때보다 heterozygosity의 확률이 작을 것이다. 이를 식으로 나타내보면

이고, 정리하면 위쪽 식과 같은 식을 얻을 수 있다. 이를 F_is (individual structure) 라고 쓰며, local subpopulation에 대한 개개인의 inbreeding coefficient 이다.
그러면 집단간의 비교는 어떻게 할 것인가? 위 식과 같은 형태이지만, heterozygote의 값이 다르다.
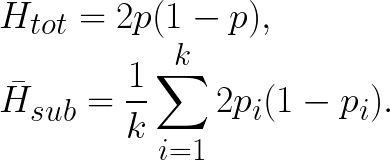
Fst (spatial structure) 라고 쓰며, total population 대비 subpopulation 사이의 inbreeding이 얼만큼 있었는지의 ratio로 정의한다. HWE에서 벗어나는 정도를 보면 집단간의 비교가 가능하다. HWE 가정에는 하나의 집단이며, random mating이 있기 때문이다.
Fst=1-(Average expected Heterozygosity within subpopulation/Expected Heterozygosity of the total population),

여기서

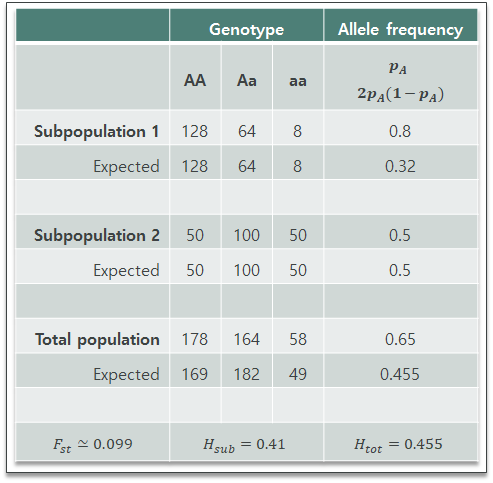
두 집단의 예를 살펴보자.

각각의 subpopulation은 HWE를 따르고 있다. 하지만 total population에서 보면 heterozygote가 expected 보다 적다. 이는 두 집단이 다름을 이야기한다. Fst는 그 정도를 나타내는 값이다.
하나의 locus에 대해서, 세 subpopulation의 예를 보자.

위 계산에 따르면 Fst는 약2%이며, 이 정도의 수치는 같은 population이라고 할 수 있다.
Heterozygosity인 p(1-p) 값은 variance로 해석이 가능하며, 아래 그림은 Fst의 직관적인 이해를 담고 있다. 즉, variance가 작다는 것은 Fst가 0에 가까운 값을 가진다는 것이고, variance가 크다는 것은 Fst가 1에 가깝다는 것이다.

1000 Genome data에서 대륙별 Fst는 다음과 같다.

$ vcftools --gzvcf data.vcf.gz --weir-fst-pop pop1_sample.lst --weir-fst-pop pop2_sample.lst --out pop1_pop2
VCFtools - 0.1.16
(C) Adam Auton and Anthony Marcketta 2009

Parameters as interpreted:
        --gzvcf data.vcf.gz
        --weir-fst-pop pop1_sample.lst
        --weir-fst-pop pop2_sample.lst
        --keep pop1_sample.lst
        --keep pop1_sample.lst
        --out pop1_pop2

Using zlib version: 1.2.7
Keeping individuals in 'keep' list
After filtering, kept 480 out of 480 Individuals
Outputting Weir and Cockerham Fst estimates.
Weir and Cockerham mean Fst estimate: 0.019248
Weir and Cockerham weighted Fst estimate: 0.01636
After filtering, kept 75566 out of a possible 75566 Sites
Run Time = 13.00 seconds

$ cat pop1_pop2.weir.fst
CHROM   POS     WEIR_AND_COCKERHAM_FST
1       762273  0.0176144
1       762320  0.0992236
1       762485  0.0653092
1       865694  0.108879
1       871215  0.0987211
1       874762  0.0144556
1       876499  0.0143876

$ vi plot_fst.py
import pandas as pd
import matplotlib.pyplot as plt


def distribution():
    for i in range(1,23):
        df=pd.read_table('pop1_pop2_chrm'+str(i)+'.weir.fst',header=None)

        plt.plot(df[1],df[2])
        plt.tight_layout()
        plt.savefig('pop1_pop2_chrm'+str(i)+'.weir.fst.png')
        plt.clf()
        print(df)


def fst_stats():
    fst_mean=[]
    fst_weight=[]
    chrom=range(1,23)

    for i in range(1,23):
        with open('pop1_pop2_chrm'+str(i)+'.log','r') as f:
            a=f.readlines()

            for result in a:
                result=result.rstrip()
                result=result.rstrip(':')
            if result[0]=='Weir and Cockerham mean Fst estimate':
                print(result[1])
                fstMeanTotal=float(result[1])
            if result[0]=='Weir and Cockerham weighted Fst estimate':
                print(result)
                fstWeightTotal=float(result[1])

    with open('pop1_pop2.log','r') as f:
        a=f.readlines()

        for result in a:
            result=result.rstrip()
            result=result.split(': ')
            if result[0]=='Weir and Cockerham mean Fst estimate':
                print(result[1])
                fstMeanTotal=float(result[1])
            if result[0]=='Weir and Cockerham weighted Fst estimate':
                print(result)
                fstWeightTotal=float(result[1])

    plt.plot(chrom,[fstMeanTotal]*22,label='Total mean',alpha=0.6)
    plt.plot(chrom,[fstWeightTotal]*22,label='Total weighted',alpha=0.6)
    plt.plot(chrom,fst_mean,label='mean',alpha=0.8)
    plt.plot(chrom,fst_weight,label='weighted',alpha=0.8)

    plt.title('Fst estimate : pop1 vs pop2',fontsize=10,fontweight='bold')
    plt.xlabel('Chromosome')
    plt.xticks(chrom)
    plt.legend()
    plt.grid(color='lightgray', linestyle='--', linewidth=0.6)
    plt.tight_layout()
    plt.savefig('pop1_pop2.weir.fst.png')
    plt.clf()

if __name__=='__main__':
    fst_stats()
Plink Fst
https://www.cog-genomics.org/plink/2.0/formats#fst_summary
$ plink2 --bfile data --fst PHENO1 --out data
# for binary case/control data
# it uses phenotype information in FAM.

$ plink2 --bfile data --fst PHENO1 method=hudson report-variants --out data
data.fst.summary # POP1   POP2    HUDSON_FST
data.CASE.CONTROL.fst.var # CHROM  POS     ID      OBS_CT  HUDSON_FST
Reference
- Fixation index, https://en.wikipedia.org/wiki/Fixation_index
- Inbreeding and Population Structure, http://www.uvm.edu/~dstratto/bcor102/readings/inbreeding.pdf
- Introduction to diversity analysis, https://www-users.york.ac.uk/~dj757/popgenomics/lectures/lecture5.pdf
'Study' 카테고리의 다른 글
| UKBioBank (0) | 2021.01.06 |
|---|---|
| SPA, Saddlepoint approximation (0) | 2020.12.30 |
| SNP 관련 (0) | 2020.10.05 |
| 1000 Genome (0) | 2020.08.20 |
| Pipeline (0) | 2020.07.31 |


댓글