SKAT-O (Optimized SKAT)
: optimize the statistical result between Burden test and SKAT.
: the optimization parameter is ρ. (ρ=1: burden test, ρ=0: SKAT)
: Optimized SKAT (SKAT-O) is a procedure which optimizes Generalized SKAT over a grid of N values of ρ between zero and 1, inclusive, in such a way as to count as only one test for multiple testing purposes instead of as N tests. (In Golden Helix SVS, seven grid points are used (N = 7), so we are talking about avoiding having to multiply the number of tests by 7 to get a proper multiple testing correction.)
Burden test
: collapse many variants into single risk score
: collapses the variant data within a region by summing the minor allele counts for each marker in the region, and testing this against the phenotype. By contrast to Count Number of Variants (Per Gene), the counts are usually weighted by a function of each marker’s minor allele frequency (MAF), so as to establish a contrast between rare and common variants.
Assumption
: assume all rare variants in a set are causal and associated with a trait in the same direction. If this is untrue, power is lost.
- Combine minor allele counts into a single risk score (dominant genetic model)
- Cohort Allelic Sums Test (CAST)
- Combined Multivariate and Collapsing (CMC)
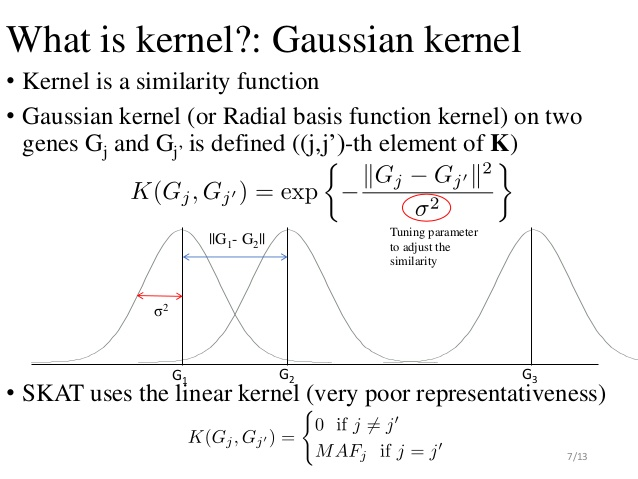
Sequence Kernel Association Test (SKAT)
: a test which collapses the variant data within a region by summing the squares of score statistics for testing individual markers. Just as for Burden testing, weights based on each marker’s MAF are usually used to establish a contrast between rare and common variants. In this case, if weighting is used, the individual squares of score statistics are weighted before they are summed.
A Powerful Variant-Set Association Test Based on Chi-Square Distribution
Genetics, Vol. 207, 903–910 November 2017
: The sequencing kernel association test (SKAT) is among the most popular rare-variant association testing methods. The SKAT is essentially based on the principal component analysis (PCA). More specifically, it calculates a test statistic from each individual principal component of the covariance matrix of the genotype data, and then takes the weighted sum of these statistics as the overall test statistic, where the weights are the associated eigenvalues. The null distribution of the overall test statistic is a linear combination of chi-square distributions, which can be approximated by a chi-quare distribution (Davies 1980; Liu et al.2009), from which a P-value can be approximated.
Reference
- https://doc.goldenhelix.com/SVS/tutorials/variant_analysis/skatAndSkato.html
- https://2wordspm.com/2020/04/06/rare-variant-association-analysis-skat-skat-o-burden-test/
'Statistics' 카테고리의 다른 글
| ANOVA (0) | 2021.06.08 |
|---|---|
| Fisher's exact test (0) | 2021.06.01 |
| P-value (0) | 2020.11.30 |
| FDR : False Discovery Rate (0) | 2020.10.26 |
| Confusion matrix (0) | 2020.10.25 |


댓글